
Educational content only. Not investment advice. This lesson explains how to read a chart. It doesn't tell you to buy or sell anything.
By the end of this lesson you can: build a liquidity map on an M15 chart, rank its levels, and explain which levels belong on the map and which have already been taken.
What "liquidity" means here
In SMC language, liquidity means resting orders: stop orders and pending orders that many traders are assumed to leave just beyond obvious highs and lows. The reasoning is simple. If many people mark the same high, many protective stops and breakout orders probably sit just above it.
This is a working assumption, not something you can see. Retail charts don't show where orders actually sit. A liquidity map is a structured list of places where orders are likely to cluster, according to a fixed set of rules. Treat it as a hypothesis to test, not as a view of the order book.
Two terms:
- Buy-side liquidity (BSL) sits above highs. Stops on short positions and buy-stop orders above a high are both buy orders.
- Sell-side liquidity (SSL) sits below lows, for the mirror-image reasons.
What goes on the map
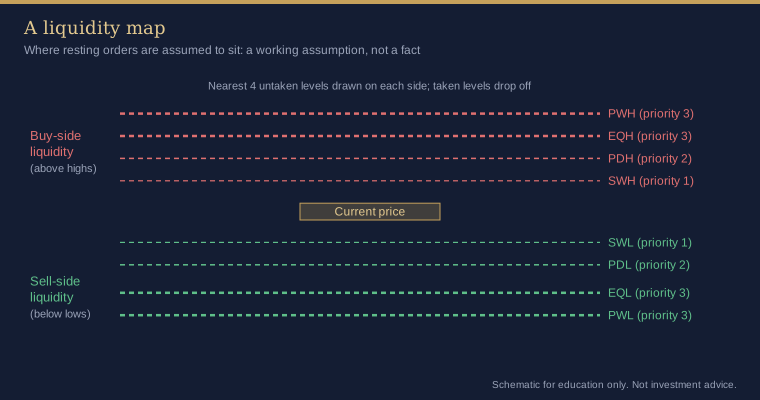
This course builds the map on M15 from four kinds of level:
- Single swing highs and lows (SWH, SWL). Pivots found with a short fractal length, for example 3 candles each side.
- Equal highs and lows (EQH, EQL). Two swing highs (or lows) within a small fraction of ATR of each other. A "double top" is easy to see, so it is assumed to attract more resting orders than a single high.
- Previous day high and low (PDH, PDL). The extremes of the previous trading day. The day boundary comes from your broker's daily candles (Course 1, Lesson 3).
- Previous week high and low (PWH, PWL). The extremes of the previous trading week.
Ranking levels
Not every level carries the same weight. A simple priority order:
| Priority | Levels | Why |
|---|---|---|
| 3 (highest) | Equal highs and lows, previous week high and low | Most visible, marked by the most chart readers |
| 2 | Previous day high and low | Marked by most intraday readers |
| 1 | Single swing highs and lows | Many of them, each less widely watched |
Priority tells you which level to look at first when several sit close together. It isn't a measure of how price will react.
When a level belongs on the map, and when it doesn't
Age. A swing that formed in the last few candles isn't much of a level yet. A minimum age (for example 4 M15 candles, one hour) keeps very fresh pivots off the map.
Taken levels drop off. Once price has traded beyond a high, the orders assumed to rest above it are assumed to have been triggered. The level is taken and comes off the map. The same applies to a PDH once today has already traded above it, or a PWH once this week has traded above it.
Lookback. The map only scans a limited window, for example the last 192 M15 candles (48 hours of chart time). Older levels may matter, but a fixed window keeps the map consistent and short.
Nearest first. Show the nearest few untaken levels on each side of price. Distant levels can come later.
The result is a short list with an ordered set of reference prices above and below the market. Everything in the rest of this course, the sweep, the CHoCH and the retest, starts from a level on this map.
Common mistakes
- Talking about liquidity as a fact ("the stops are at …") instead of an assumption.
- Leaving taken levels on the chart and then treating them as untouched.
- Mixing broker day boundaries: a PDH from one broker can differ from another's.
- Mapping every tiny pivot, so the map has twenty lines and no ranking.
How the indicator shows this
The AURUM Liquidity Retest indicator builds its map on the Liquidity + structure timeframe (default M15) and rebuilds it at every M15 candle close. The relevant LIQUIDITY MAP (HTF) inputs:
- Swing fractal strength (default 3): a swing high must be above the 3 candles on each side.
- HTF bars scanned for liquidity (default 192).
- Min swing age (default 4 M15 candles). A swing also counts only while no later candle has traded at or beyond it.
- Use equal highs / lows with Equal highs / lows tolerance (default 0.10 × M15 ATR). Two untaken swings within that distance become one EQH or EQL at the more extreme of the two prices.
- Use previous day high / low and Use previous week high / low: taken from the broker's D1 and W1 candles, and listed only while the current day or week hasn't yet traded beyond them.
- Priority inside the code is the same as the table above: EQH/EQL and PWH/PWL = 3, PDH/PDL = 2, single swings = 1.
On the chart, Liquidity levels drawn per side (default 4) sets how many of the nearest untaken levels are drawn above and below price. Buy-side levels are red dotted lines and sell-side levels are green. Priority-3 levels are drawn thicker. Each line is labelled with its source and price, for example PDH 4xxx.xx, and the tooltip reads "Buy-side liquidity PDH … (unswept)". When a level is taken it disappears at the next M15 close.
The ATR here is a simple 14-candle average of true range, so ATR multiples aren't directly comparable with the Aurum SMC signal XAUUSD indicator, which uses a smoothed ATR.
Key takeaways
- Liquidity is an assumption about where resting orders cluster: above highs (buy-side) and below lows (sell-side).
- The map uses swing levels, equal highs and lows, PDH/PDL and PWH/PWL, ranked by priority.
- Levels need a minimum age and drop off once taken.
- Keep the map short: the nearest untaken levels on each side.
Practice exercise
- On XAUUSD M15, take the last two days and mark every swing high and low with a 3-candle fractal that is at least four candles old.
- Remove every level price has since traded beyond.
- Mark the PDH, PDL, PWH and PWL from your broker's daily and weekly candles, and any equal highs or lows within 0.10 ATR.
- Rank the levels by priority and keep the nearest four on each side. Save a dated screenshot.
- If you have the indicator, compare its map with yours and explain every difference.
Not investment advice. This lesson is for education only. Trading leveraged products such as CFDs on gold carries a high risk of losing money quickly. Examples are illustrative and say nothing about future results.